Building a Better Bottle Lab Report
I. Abstract
We were investigating how to construct an insulated water bottle that stopped the transfer of heat through radiation, conduction, and convection. My hypothesis was that if I wrap a water bottle in 1.5 inch bed foam and alternating layers of tin foil and reflective tape, then I would reduce the transfer of heat because the materials prevent heat from being transferred. To conduct this experiment, we placed our insulated bottles in a hot water bath for 1 hour and 10 minutes, and recorded the temperature of the water in the water bottle every 5 minutes. The control of the experiment was a water bottle without any insulation. I found that my designed bottle did much better at reducing heat transfer than the standard water bottle. My bottle gained on average 0.23 degrees celsius per minute, while the regular water bottle gained about 1.8 degrees celsius per minute. This is a more than 1.5 degrees per minute! I concluded from this experiment that my hypothesis was supported in that bed foam and tin foil would suppress the transfer of heat between the water bottle and the hot water bath.
II. Introduction
The problem that we were investigating was to research and build a water bottle that better insulated and helped prevent the three different types of heat transfer. My hypothesis was that if I wrapped the bottle in approximately 1.5 inches of bed foam, then it will stop the transfer of heat through conduction and convection as the air locked in the air pockets will stop the heat. To stop the flow of radiation, I used alternating layers of aluminum foil and reflective tape as this reflects electromagnetic waves from reaching the bottle.
The three types of heat transfer are conduction, convection, and radiation. Conduction is the transfer of heat energy through two objects as they touch one another. This means, that if one object is hotter than the other and the objects are touching, the hotter object will transfer energy to the other object. The next type of heat transfer is convection. This type of heat transfer is the transfer of heat energy through a fluid, a fluid being a liquid or gas. The third and final method of heat transfer that we were investigating was radiation. Radiation is the transfer of heat energy through an empty space such as the open air. Energy is emitted by one object, travels through the open air, for example, and absorbed by another object.
To create my “better bottle”, I began by wrapping 1.5 inch bead foam around my 16.9 fl. oz. Poland Spring® water bottle. As I was applying this bed foam, I hot glued it down to the bottle for a temporary hold. I then covered this in reflective tape so that this holds permanently. I then began wrapping this in alternating layers of tin foil and reflective tape. I then slid this creation into a two liter bottle to provide a shell and to make sure this is watertight. The reason that I wanted my bottle to be watertight was that I didn’t want the bed foam to soak up any water. If it soaked up any water, then because it was in direct contact with the bottle inside, it would cause conduction, which I was trying to prevent. My reasoning behind the construction and materials for this lab was to protect against all forms of heat transfer. To stop conduction, I chose the bed foam as it provides separation between the bottle and the hot water. To prevent radiation, I chose the tin foil and reflective tape to block electromagnetic waves from reaching my bottle. Finally, to stop convection, the air pockets in the bed foam help stop fluid from carrying energy from the bottle to the hot water bath and vice versa.
The independent variable for this experiment was the elapsed time the water bottle spent in the hot water bath, in minutes. The dependent variable was the temperature of the water in the bottle, in degrees celsius. The variables that we decided to remain constant were as follows: the size of the water bottle (16.9 fl. oz.), the time in between temperature readings (every 5 minutes), temperature of room, and the starting temperature of the water inside the water bottle, and the temperature of the hot water bath. The control of this experiment was a standard water bottle with no insulators placed into a hot water bath.
III. Procedure
IV. Results
I. Abstract
We were investigating how to construct an insulated water bottle that stopped the transfer of heat through radiation, conduction, and convection. My hypothesis was that if I wrap a water bottle in 1.5 inch bed foam and alternating layers of tin foil and reflective tape, then I would reduce the transfer of heat because the materials prevent heat from being transferred. To conduct this experiment, we placed our insulated bottles in a hot water bath for 1 hour and 10 minutes, and recorded the temperature of the water in the water bottle every 5 minutes. The control of the experiment was a water bottle without any insulation. I found that my designed bottle did much better at reducing heat transfer than the standard water bottle. My bottle gained on average 0.23 degrees celsius per minute, while the regular water bottle gained about 1.8 degrees celsius per minute. This is a more than 1.5 degrees per minute! I concluded from this experiment that my hypothesis was supported in that bed foam and tin foil would suppress the transfer of heat between the water bottle and the hot water bath.
II. Introduction
The problem that we were investigating was to research and build a water bottle that better insulated and helped prevent the three different types of heat transfer. My hypothesis was that if I wrapped the bottle in approximately 1.5 inches of bed foam, then it will stop the transfer of heat through conduction and convection as the air locked in the air pockets will stop the heat. To stop the flow of radiation, I used alternating layers of aluminum foil and reflective tape as this reflects electromagnetic waves from reaching the bottle.
The three types of heat transfer are conduction, convection, and radiation. Conduction is the transfer of heat energy through two objects as they touch one another. This means, that if one object is hotter than the other and the objects are touching, the hotter object will transfer energy to the other object. The next type of heat transfer is convection. This type of heat transfer is the transfer of heat energy through a fluid, a fluid being a liquid or gas. The third and final method of heat transfer that we were investigating was radiation. Radiation is the transfer of heat energy through an empty space such as the open air. Energy is emitted by one object, travels through the open air, for example, and absorbed by another object.
To create my “better bottle”, I began by wrapping 1.5 inch bead foam around my 16.9 fl. oz. Poland Spring® water bottle. As I was applying this bed foam, I hot glued it down to the bottle for a temporary hold. I then covered this in reflective tape so that this holds permanently. I then began wrapping this in alternating layers of tin foil and reflective tape. I then slid this creation into a two liter bottle to provide a shell and to make sure this is watertight. The reason that I wanted my bottle to be watertight was that I didn’t want the bed foam to soak up any water. If it soaked up any water, then because it was in direct contact with the bottle inside, it would cause conduction, which I was trying to prevent. My reasoning behind the construction and materials for this lab was to protect against all forms of heat transfer. To stop conduction, I chose the bed foam as it provides separation between the bottle and the hot water. To prevent radiation, I chose the tin foil and reflective tape to block electromagnetic waves from reaching my bottle. Finally, to stop convection, the air pockets in the bed foam help stop fluid from carrying energy from the bottle to the hot water bath and vice versa.
The independent variable for this experiment was the elapsed time the water bottle spent in the hot water bath, in minutes. The dependent variable was the temperature of the water in the bottle, in degrees celsius. The variables that we decided to remain constant were as follows: the size of the water bottle (16.9 fl. oz.), the time in between temperature readings (every 5 minutes), temperature of room, and the starting temperature of the water inside the water bottle, and the temperature of the hot water bath. The control of this experiment was a standard water bottle with no insulators placed into a hot water bath.
III. Procedure
- Gather materials needed for the lab.
- Remove the cap of both water bottles (from refrigerator and your designed bottle.
- Using a funnel, pour all water from cold bottle (from refrigerator) into your designed bottle.
- Place homemade water bottle into the sink in which you will conduct your experiment, and measure and record the starting temperature of the water in the bottle, in degrees celsius, in a data table.
- Stretch strips of tape along the width of the table, and make sure you cover the tops of the water bottles on either side of the bottle, but remember to leave space for the thermometer.
- Take the black, cylindrical plug, and press it firmly into the drain until it is stable and secured. This creates a watertight seal for the drain.
- Begin slowly turning the hot water handle on the sink and wait for the sink to begin filling up.
- Start the timer as soon as the water in the sink begins overflowing over the black plug in the drain.
- Turn off the hot water and let the bottle(s) sit in the hot water bath.
- Record temperatures of both the hot water and water from the water bottle, in degrees celsius, at intervals of 5 minutes, and record in a data table.
- Every 20 minutes, run the hot water in the sink for exactly one minute.
- Repeat steps 1-11 for the control group (water bottle with no added insulation).
IV. Results
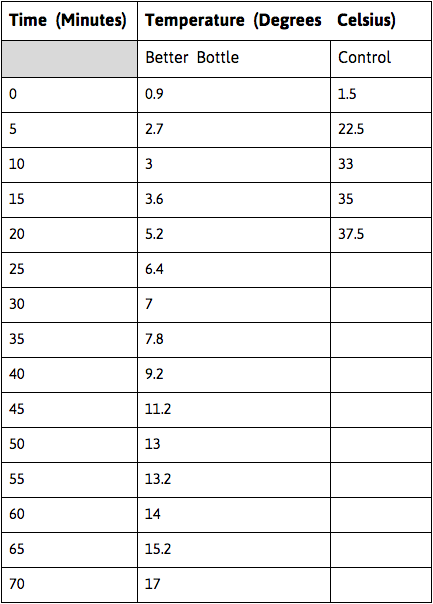
Temperature as a Function of Time:

Cross Section:

Legend:
Black bars: plastic bottle
Grey area: tin foil and reflective tape (alternating layers)
Beige area: bed foam
White area: 16.9 fl. oz. water bottle
Data Analysis:
As you can probably see, the data for the control group ended after 20 minutes. This is due to the fact that the temperature of the water in the water bottle caught up to the temperature of the sink water. We ended this experiment here because the temperature would stay the same as the two temperatures equaled each other.
V. Conclusions and Discussion
My hypothesis was proven to be correct as my design prevented the three types of heat transfer. Of course, some energy did transfer from the water bottle to the hot water bath and vice versa, but for the most part, it prevented all three types of heat transfer. To prove that my hypothesis was supported, the blue line in the chart, the improved water bottle, remains much lower than the red line, or the control. This shows that I prevented heat transfer in all three ways. Another way that I can explain that my hypothesis was supported is by looking at the data table. If you find the average increase in temperature of the control vs the better bottle, the better bottle increases only about 0.23 degrees celsius while the regular bottle increases by about 1.8 degrees. The relationship between the amount of time that the bottle sits in the hot water bath and the temperature of the water exists because the longer the water bottle is in the hot water, the warmer it will get.
I do have an issue with the validity of my data. When I went to check my temperatures using the thermometer, at first, I was looking down on the thermometer which meant that my data was off by margins of about 0.3 degrees. I first noticed that I was doing this about ⅓ of the way through the experiment. Then, I wanted to make sure that I was reading the thermometer from the correct angle, so I pulled it out of the water bottle to get to my eye level. On the second to last measurement, I noticed that the temperature rose a bit when I pulled it out of the water. This meant that it must have done the same for all of the other measurements. It was not a significant increase, however. It was only about a 0.1 - 0.25 degree celsius increase. This is an experimental error, in my opinion, as my procedure never explained how to properly take the measurement. Another experimental error that I ran into when conducting this experiment was that for the first time that we ran the water in the sink at the 20 minute mark, I had not written down in my procedure exactly how long that we should run the water for. I am estimating that I only ran the water for about 30 seconds.
To improve on this experiment, in the future, I will run the experiment 3 times in total with an identical procedure. Then, I will average these 3 sets together to create a much more accurate data set. Another way that I could improve on the experiment is to have made the procedure easier to follow and describe each step in full detail. This would improve the experiment for next time as it would allow the person conducting it to know how to do each step. For example, the data would be more precise if taking the temperature of the water was explained in more detail.
Acid Rain’s Effect on the Mass of Various Types of Rocks
I. Abstract
We needed to figure out the percentage of mass lost or gained in rock samples with acid rain exposure. My hypothesis was, “If we expose acid rain to different rock samples, then marble will be the most resistant to acid rain because of its calcite content”. In this lab, I took various rock samples and soaked them in vinegar for an extended length of time. Then, I found the percent of the difference in mass between the starting mass and ending mass. My results were not accurate and invalid compared to the class average. I found that if I measured my rocks more accurately, and found rocks of closer masses, then my data would be more valid.
II. Introduction
The issue that we were exploring was to find which rocks are most resistant to acid rain. My hypothesis was, “If we expose acid rain to different rock samples, then marble will be the most resistant to acid rain because of its calcite content”.
When conducting some background research, I found that chemically created acid rain has a pH level of around 4.2, while neutral, or regular water, has a pH level of 7. I was unsure of what a pH scale was, so I found that it was a scale of numbers between 1 and 14 which tell if something is more acidic or basic than neutral (7). I also found that each whole number on the pH scale is tenfold, or 10 times greater than the last number on the scale. For this experiment we used vinegar, and I learned that distilled vinegar has a pH level of about 2.4. Out of the four rock samples that we used for this experiment (red sandstone, limestone, marble, and granite), only marble and limestone contain calcite. This is interesting because marble is the rock formed when limestone is subjected to metamorphism (heat and pressure). I found that acid rain is formed when the chemicals created by burning fossil fuels such as coal and oil are released into the clouds where it mixes with rainwater.
The independent variable for this experiment was the type of rock chip that we used, and the dependent variable was the percentage of mass lost due to the rock chip being submerged in vinegar. When conducting this experiment, we needed to make sure that we kept the amount of vinegar/water, the amount of time each rock is submerged, and the area in which the experiment took place, all the same. Our control group was regular water to represent regular rainwater.
III. Procedure
- Gather all materials needed for the lab
- Find four rock samples (limestone, sandstone, marble, and granite) of roughly the same mass
- Calculate the mass of each rock sample using a triple beam balance to the 100th of a gram, and record the rock’s starting mass, and record them in a data table.
- Put the limestone sample in a clear, plastic cup
- Using a 100 mL graduated cylinder, measure 80 mL of vinegar
- Pour the vinegar over the limestone sample into the cup, and make sure that the rock is completely submerged in vinegar
- If the rock is not completely submerged, move the rock in a position where the rock is completely under the vinegar.
- Tear off a strip of masking tape and write clearly both your and your partners’ names, and which rock sample is in the cup
- Put the strip of masking tape on the side of the cup neatly.
- Repeat steps 4-8 on the rest of the rock samples
- As a control group, repeat steps 4-8, but instead of using vinegar to soak the rock samples in, use tap water.
- Place each of your cups of rocks submerged in vinegar on the designated area, and let them sit for two days.
- After two days in vinegar, take each rock out of the cup, and pour the rest of the vinegar down the sink’s drain.
- Dry each rock sample
- Calculate the rock’s mass using a triple beam balance to the 100th of a gram, and record the rock’s ending mass in a data table.
IV. Conclusion and Discussion
The problem that we were exploring was, “How does acid rain affect different types of rocks?”. My hypothesis was, “If we expose acid rain to different rock samples, then marble will be the most resistant to acid rain because of its calcite content”. My hypothesis was rejected because marble was the least resistant.
Our results were not very similar to the class data. Many of our rocks gained mass, which meant that there was human error somewhere in the process of measuring either the starting mass, ending mass, or both. The rocks that supposedly “gained weight” were limestone and granite. This data is very invalid because the percent of mass gained was 7% of the rock’s starting mass and even above. Our rock samples that were accurate were marble and sandstone. It does make sense that sandstone would gain weight because of it’s loosely compacted structure, the vinegar seeps through the cracks between the sand. Had we let it dry longer, the vinegar would have dried up giving us more accurate data.The rest of the class had similar results in that the sandstone gained weight. My partner and my data was actually within 1.5% of the class data! Had we let it dry longer, the vinegar would have dried up giving us more accurate data. Marble was the only rock in our data that actually lost mass. This was within 1% of the class average.
While comparing my data to the class averages, I have concluded that Granite is the most resistant to acid rain. I have concluded this because it is the closest change in percentage to 0% mass lost. In the data (excluding our data of course), Granite only lost 0.16% of its starting mass, while all others lost greater than 3% of their starting masses (except sandstone due to the reason stated above).
The relationship between the type of rock sample and the difference in percentage of mass exists because of how acid rain affects the mass of each rock differently. Acid rain (or in this case vinegar) reacted differently with each type of rock that we tested. While sandstone absorbed the vinegar and “gained mass”, granite only lost 0.16% of its original mass. The relationship is how much of a difference the percent of change in mass of each rock has.
As I said before, I think my data is invalid because rocks cannot gain more than 7% of their original mass after being exposed to vinegar for two days. I think either one of two situations occurred. The first possible situation that could result in this “skewed” data could be that we measured either the starting mass, ending mass, or even both wrong. This is the more likely of the two situations because it can be very easy to calculate the data wrong. The other situation that is less likely, but still possible, is that the triple beam balances were not calibrated correctly. I did not make sure that the pointer was at zero to begin with, so this situation cannot be ruled out.
One example of experimental error that I came across when completing this lab was that the rocks were not as close in mass as I would have hoped. What I should have done was to weigh each rock sample and find the rocks with the closest mass so that I could have more accurate results. Another source of experimental error I found was that I may have weighed my rock samples wrong because of how skewed my data is from the class averages. An improvement I can make in the future is to weigh everything, in this case rocks, at least twice in order to be confident that the measurement was done correctly and accurately.
